A trading card vending machine can look profitable on the surface and still produce a weak return once merchandise cost, placement fees, card processing, restocking labor, service calls, refunds, and idle inventory are included. That is why I’d recommend using a vending machine ROI calculator before comparing cabinets, screens, or payment hardware. The correct question is not simply, “How much can the machine sell?” It is, “How much operating cash can this specific machine produce from the capital tied up in equipment and inventory?” This guide gives you the formulas, a working calculator, scenario tables, break-even rules, and equipment-selection checks I’d recommend using when evaluating a trading card vending project. The goal is a decision you can defend with numbers, not a revenue estimate built on optimistic traffic assumptions.
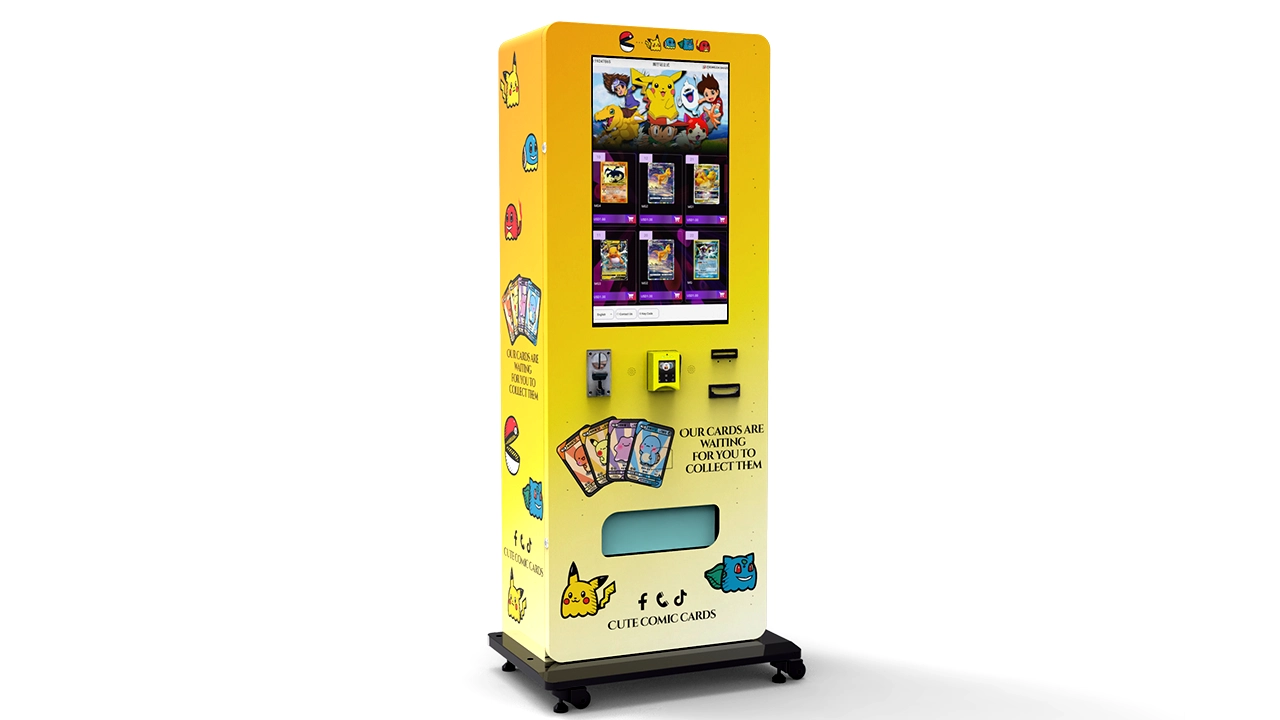
Trading Card Vending Machine ROI Calculator
The calculator below is designed around cash operating performance. It starts with the money committed before launch, then subtracts the variable and fixed costs required to produce each month of sales. In my view, this structure works better because it exposes the two numbers that matter most in an unattended retail project: monthly operating profit and simple payback period.
A useful vending machine ROI calculator should not treat gross margin as net profit. It should also avoid hiding venue commission, payment processing, service labor, software, shrink, and maintenance inside a vague “other” line. If those costs are real, they belong in the model.
Enter Your Assumptions
Calculated Results
| Startup capital | $7,800.00 |
|---|---|
| Monthly operating profit | $1,000.00 |
| Operating margin | 20.0% |
| Annual simple ROI | 153.8% |
| Simple payback period | 7.8 months |
| Monthly break-even sales | $1,153.85 |
This calculator is an operating model, not a forecast, tax calculation, accounting statement, financing model, or guarantee of results. Replace every default with your own quote, invoice, contract, and operating assumptions.
The ROI Formula That Actually Matters
The basic return formula is simple:
Annual Simple ROI = Annual Operating Profit ÷ Total Startup Capital × 100
The hard part is not the arithmetic. The hard part is deciding what belongs in operating profit and what belongs in startup capital. A weak vending machine ROI calculator can produce a beautiful percentage from incomplete inputs. A rigorous model forces every meaningful cash requirement into view.
For this comparison, I’m treating startup capital as:
Startup Capital = Machine + Payment Hardware + Freight + Installation + Branding + Initial Setup + Starting Inventory + Other Launch Costs
For this comparison, I’m calculating monthly operating profit as:
Monthly Operating Profit = Sales − Merchandise Cost − Payment Fees − Venue Cost − Refunds/Shrink − Restocking Labor − Connectivity/Software − Maintenance Reserve − Other Direct Operating Costs
The simple payback formula is:
Payback Period in Months = Startup Capital ÷ Monthly Operating Profit
That payback figure is only meaningful when monthly profit is positive and reasonably repeatable. If your projected monthly profit is $900 but one popular set drives half the sales, you do not yet have a stable nine-month or ten-month payback model. You have a scenario that depends heavily on one product cycle.
For this comparison, I’m prioritizing cash payback, operating margin, break-even revenue, inventory efficiency, and downside resilience. Those measures are easier to audit than a single headline ROI percentage.
ROI Is Not the Same as Gross Margin
Suppose a sealed product sells for $20 and costs you $12. The merchandise gross margin is $8, or 40%. That does not mean the machine makes 40% net profit. A 10% venue commission removes $2. Payment processing might remove another amount. Refunds, failed vends, restocking labor, connectivity, and maintenance still have to be paid.
This distinction is where a trading-card-specific vending machine ROI calculator becomes more useful than a generic markup tool. Merchandise margin tells you whether the product is worth stocking. ROI tells you whether the entire automated retail system is worth funding.
Every Cost the Calculator Should Include
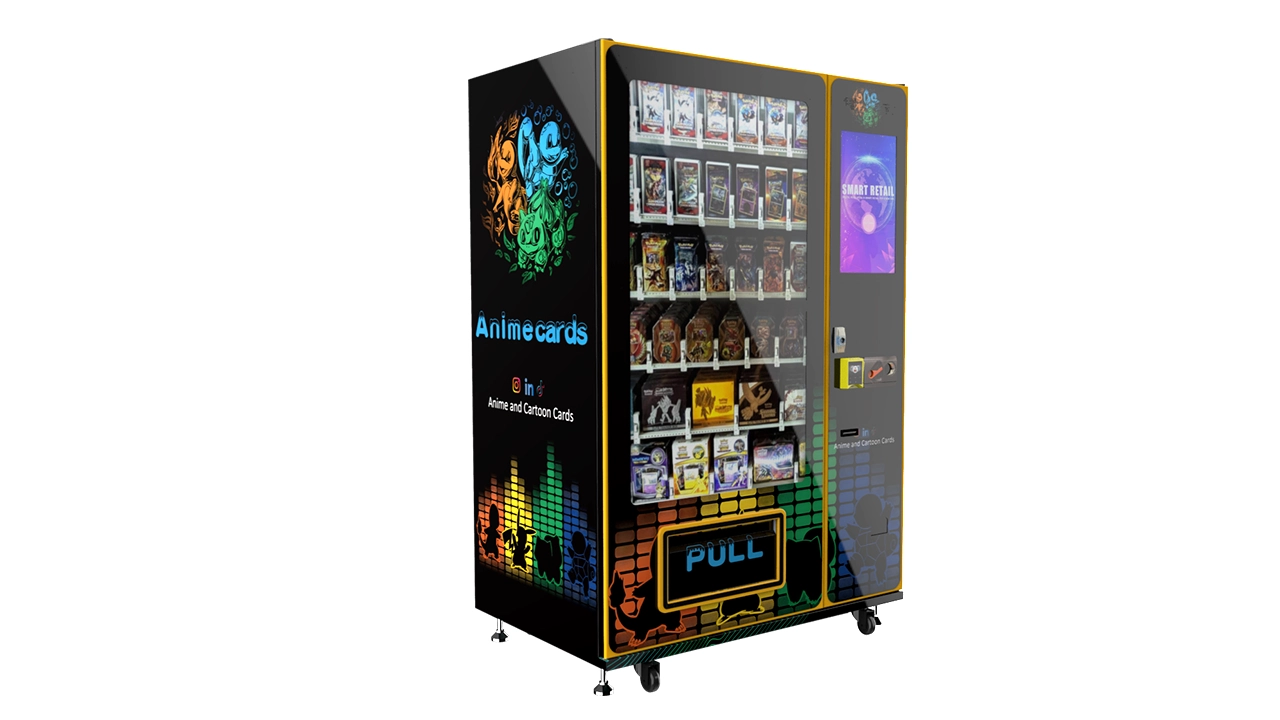
When someone shows me a vending machine ROI calculator with only machine price, sales, and product cost, I think the result is incomplete until proven otherwise. Trading cards are compact, high-interest products, but they also create specific operating costs: frequent assortment changes, high-value inventory, condition-sensitive packaging, chargebacks or refund requests, and service trips triggered by fast stockouts.
| Input | Where to Get It | Why It Matters |
|---|---|---|
| Machine purchase price | Manufacturer quotation | Main equipment capital |
| Freight and installation | Freight quote, installer quote | Often excluded from advertised machine pricing |
| Payment hardware | Payment provider or machine quotation | May be bundled or separate |
| Starting inventory | Supplier invoices | Cash is tied up before the first sale |
| Merchandise cost | Actual landed invoice cost | Usually the largest variable cost |
| Venue commission or rent | Signed placement agreement | Can change a good site into a weak one |
| Payment processing | Merchant statement or provider quote | Applies to each cashless transaction |
| Restocking labor | Your labor rate × service time | Route economics deteriorate when trips are frequent |
| Travel cost | Route distance and vehicle cost | A small machine can become expensive to service |
| Software/connectivity | Platform and network plan | Supports remote inventory and status checks |
| Maintenance reserve | Planned monthly allowance | Prevents occasional repair bills from distorting ROI |
| Refunds and shrink | Actual operating history or cautious allowance | Covers failed delivery, damage, theft, and discrepancies |
Before changing any assumptions, save one baseline version of the vending machine ROI calculator. That gives you a fixed reference point when supplier quotes or placement terms change.
Use Landed Cost, Not Just Purchase Price
If you pay $10 for a product but also incur inbound freight, handling, or preparation costs, the real merchandise cost can be higher. The same rule applies to the machine itself. A $5,000 cabinet that needs $900 of freight, setup, power work, anchoring, and graphics is not a $5,000 project.
I’d recommend entering landed cash cost everywhere possible. A vending machine payback period calculated from incomplete acquisition cost will always look better than the cash reality.
Separate One-Time Cost From Monthly Cost
One-time costs belong in the ROI denominator. Monthly costs belong in operating profit. Mixing the two makes it difficult to understand whether a weak result comes from an expensive launch or weak ongoing economics.
For example, custom cabinet graphics may raise startup capital but have little effect on monthly operating cost. A venue commission does the opposite: it may require no upfront cash but reduce every month of contribution. Your vending machine ROI calculator should show those effects separately.
How to Estimate Sales Without Guessing
Revenue is the easiest line to inflate. A busy hallway does not guarantee sales, and a strong release week does not define a normal month. I’d recommend building sales from observable drivers and then comparing the result with actual transaction data as soon as the machine goes live.
A practical sales formula is:
Monthly Sales = Relevant Daily Passersby × Purchase Conversion Rate × Average Transaction Value × Operating Days
The phrase “relevant passersby” matters. Ten thousand people who have no interest in cards can be less valuable than a smaller flow of customers who already buy collectibles. Location quality is not just traffic volume; it is traffic fit.
Example Sales Build
Assume the point of sale is exposed to 220 relevant passersby per day. If 4% buy and the average transaction value is $18, operating for 30 days gives:
220 × 4% × $18 × 30 = $4,752 monthly sales
Now change conversion from 4% to 2.5%:
220 × 2.5% × $18 × 30 = $2,970 monthly sales
That one assumption reduces revenue by $1,782. This is why the sales section of a vending machine ROI calculator deserves more attention than the final ROI percentage. A model is only as strong as the behavior assumption underneath it.
Run the same traffic assumptions through the vending machine ROI calculator at several conversion rates. The spread between those outputs is often more useful than a single forecast.
Do Not Use Peak Release Days as the Baseline
Trading card demand can move sharply around new releases, popular characters, athlete performance, tournament activity, social attention, and scarcity. eBay’s 2025 Collected report is useful evidence of that volatility: Pokémon and Pokémon Cards ranked among the most-searched collectibles in its report, while individual sports names experienced major search spikes over short periods. That does not tell you what a vending machine will earn. It does tell you that assortment demand can move quickly enough to justify a flexible product plan and close inventory monitoring.
Source: eBay Collected: 2025 in Collecting Trends.[2]
I’d choose a normal-month baseline built from conservative conversion and average ticket assumptions, then create a separate release-driven upside case. Do not make the upside case your base case.
Trading Card Margin and Product Mix
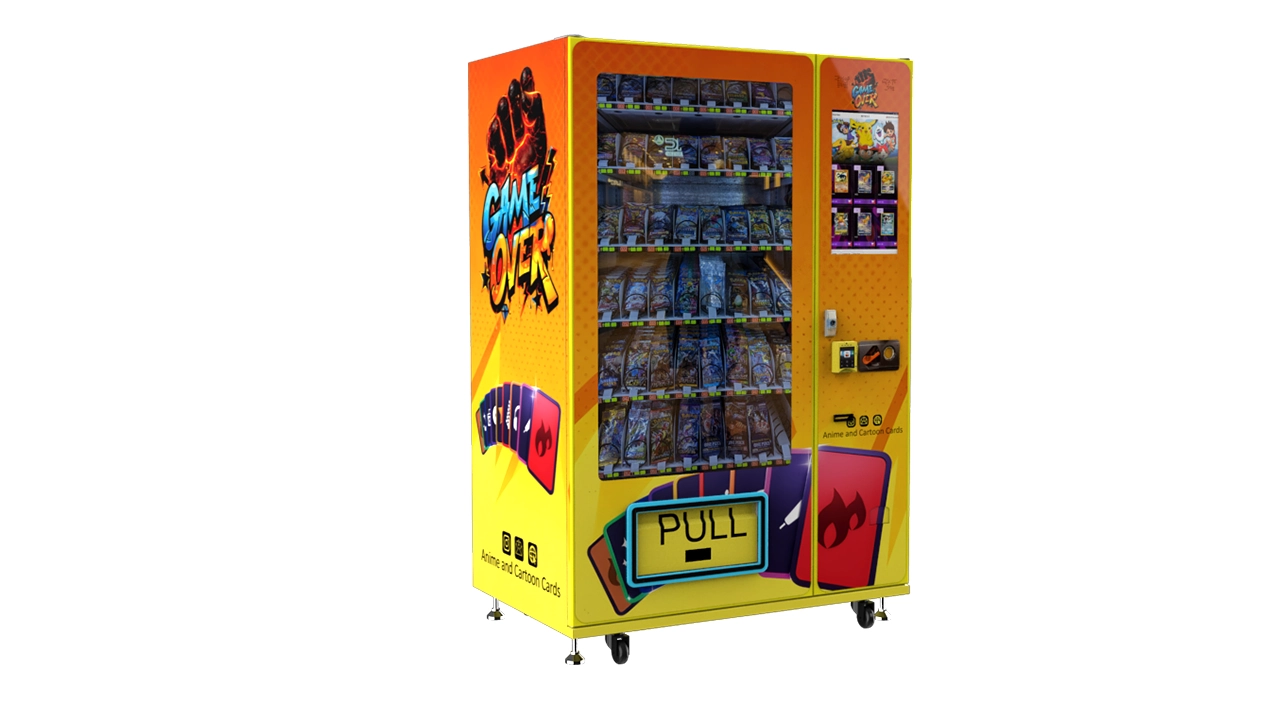
The machine cannot repair a bad buy price. If the spread between your landed product cost and selling price is too narrow, higher volume may simply create more low-margin transactions. That is one of the most important lessons in trading card vending machine profitability.
For each SKU, calculate:
Gross Merchandise Margin = Selling Price − Landed Product Cost
Gross Merchandise Margin % = Gross Merchandise Margin ÷ Selling Price × 100
Then calculate contribution after transaction-level costs:
Unit Contribution = Selling Price − Product Cost − Payment Cost − Venue Commission − Expected Refund/Shrink Allowance − Other Per-Sale Cost
A vending machine ROI calculator should ultimately be fed by this contribution logic, because revenue alone can hide a poor product mix.
At this stage, the vending machine ROI calculator should be treated as a product-mix model as much as an equipment model.
Illustrative Product Mix
The table below is deliberately illustrative. It is not a pricing guide and does not represent a guaranteed wholesale or retail price. Replace every number with your own invoice and selling price.
| Product Type | Selling Price | Landed Cost | Gross Margin | Gross Margin % |
|---|---|---|---|---|
| Single sealed pack | $8.00 | $4.80 | $3.20 | 40.0% |
| Premium pack | $15.00 | $9.00 | $6.00 | 40.0% |
| Small sealed box | $32.00 | $20.50 | $11.50 | 35.9% |
| Collector bundle | $48.00 | $30.00 | $18.00 | 37.5% |
If a product has a high selling price but a thin margin, it can make sales look impressive while adding little cash after venue and processing costs. If I were choosing for an unattended machine, I’d rank SKUs by contribution dollars, sales velocity, package reliability, and replenishment availability rather than by ticket price alone.
Calculate the Maximum Product Cost You Can Accept
You can reverse the equation before buying inventory. Suppose you want a 15% operating contribution before fixed monthly costs. The item sells for $20. Payment cost is modeled at 3%, venue commission at 10%, and refunds/shrink at 1%.
Maximum Product Cost = Selling Price × (1 − Payment % − Venue % − Shrink % − Target Contribution %)
$20 × (1 − 0.03 − 0.10 − 0.01 − 0.15) = $14.20
If your landed cost is above $14.20, the SKU misses that target before fixed service costs. This type of reverse calculation belongs next to your vending machine ROI calculator because it turns ROI from a reporting tool into a buying discipline.
Why Category Scale Does Not Guarantee Machine Profit
The Pokémon Company reported total trading card production of more than 85 billion cards as of the end of March 2026. That is a meaningful indicator of category scale and longevity. It is not evidence that every automated retail placement will be profitable. A large category can still produce poor machine economics when product acquisition cost is high, inventory is stale, or the placement does not convert.
Source: The Pokémon Company — Pokémon in Figures.[1]
Inventory Turn, Stockouts, and Working Capital
Trading cards create a cash-management problem that a basic vending machine ROI calculator often misses. You may have a machine that appears to pay back quickly based on operating profit, while a growing amount of cash is tied up in slow stock, duplicate inventory, or products purchased ahead of releases.
I’d recommend tracking at least four inventory metrics:
- Inventory turn: how quickly inventory at cost is sold and replaced.
- Days of inventory: how long the average stock position would last at current cost of goods sold.
- Stockout rate: how often proven sellers are unavailable.
- Gross margin return on inventory: how many gross-margin dollars the inventory produces relative to the average cash tied up in it.
A simple monthly inventory-turn formula is:
Monthly Inventory Turn = Monthly Cost of Goods Sold ÷ Average Inventory at Cost
If monthly cost of goods sold is $3,000 and average inventory at cost is $2,000, monthly turn is 1.5. If the same $3,000 cost of goods sold requires $6,000 of average inventory, turn falls to 0.5. Revenue might be identical in both cases, but the second model ties up three times as much inventory cash.
Inventory assumptions should be updated in the vending machine ROI calculator whenever the average product cost or service interval changes materially.
Stockouts Have an ROI Cost Too
Holding too much stock hurts cash efficiency, but holding too little can also damage return. If your best product is empty for four days, you lose sales and may train repeat customers to stop checking the machine.
Remote inventory monitoring is therefore more than a convenience feature. It can reduce unnecessary trips while helping you protect high-velocity lanes. Zhongda Smart publishes connected trading-card vending configurations with remote sales and inventory functions; for an overview of available formats, see the trading card vending machine lineup.
Do Not Count Initial Inventory Twice
Initial inventory is usually included in startup capital because cash must be committed before sales begin. When products sell, their cost is also recognized in monthly merchandise cost. That is not double-counting when you interpret the model correctly: one measure tracks capital committed, while the other tracks the cost associated with each period’s sales.
What you should avoid is subtracting the full starting inventory balance from monthly profit in addition to normal cost of goods sold. A well-built vending machine ROI calculator separates capital tied up from expense recognized against sales.
Location Economics and Placement Fees
A premium machine in a weak location is still a weak investment. In automated retail, location determines the number and quality of purchase opportunities. The venue agreement then decides how much of the resulting revenue you keep.
There are three common structures to model:
- Percentage commission: the venue receives a percentage of gross sales.
- Fixed rent: you pay a flat monthly amount regardless of sales.
- Hybrid arrangement: a fixed minimum plus a percentage above a threshold.
For placement negotiations, I’d recommend running the vending machine ROI calculator before and after every proposed fee structure instead of evaluating the commission in isolation.
Percentage Commission
A percentage commission scales with sales. That protects downside cash flow because the venue cost falls when sales fall, but it also takes more dollars as the machine improves. If monthly sales are $5,000, a 10% commission costs $500. At $8,000 of sales, the same agreement costs $800.
Fixed Rent
Fixed rent behaves in the opposite way. A $400 monthly fee hurts a weak machine more but becomes relatively efficient at higher volume. At $2,000 in sales, it consumes 20% of revenue. At $8,000, it consumes 5%.
Your vending machine ROI calculator should therefore match the actual contract structure. Do not enter a flat rent as a percentage or a percentage commission as a fixed cost just because the spreadsheet is easier that way.
Compare Locations on Contribution, Not Traffic
Suppose Site A produces $6,000 in monthly sales at a 16% operating margin after venue cost. Site B produces $4,800 at a 24% margin. Site A contributes $960. Site B contributes $1,152. The lower-revenue location is financially better before considering any difference in capital or service time.
That is why I’d rank placements by monthly contribution, contribution per service hour, stock turn, and stability rather than by revenue alone.
Choosing the Right Machine for the ROI Model
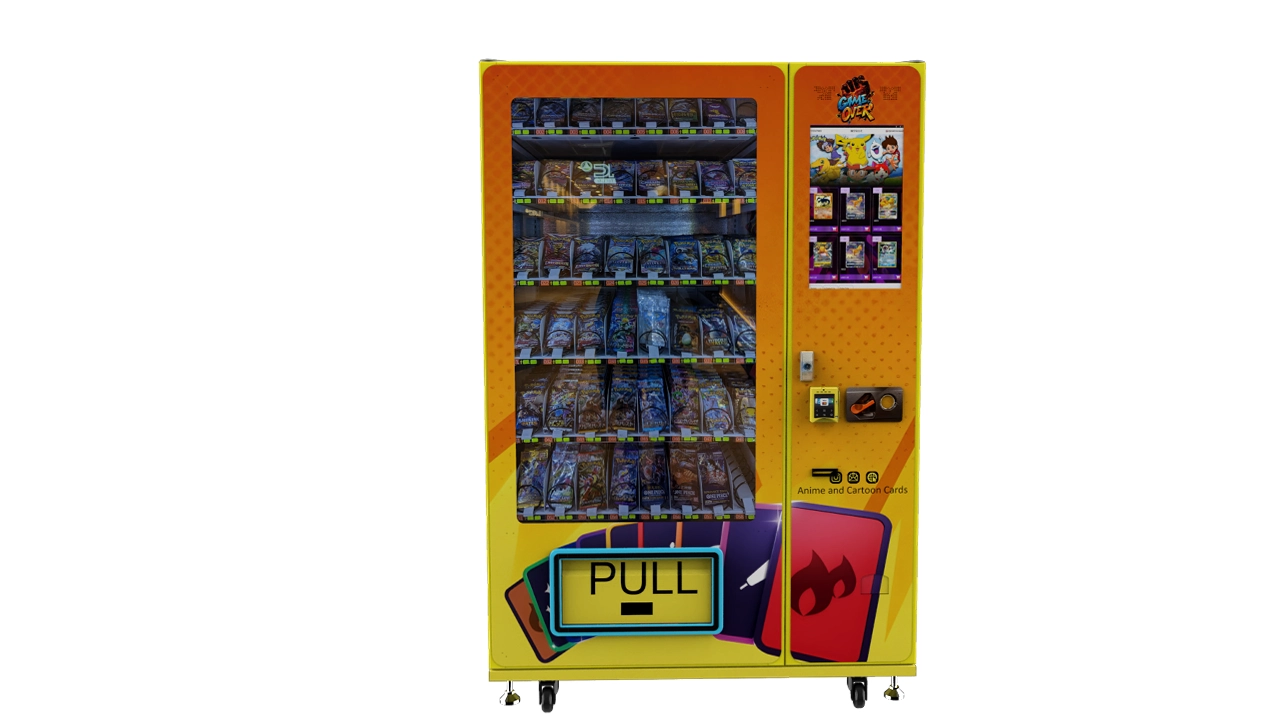
Machine selection changes both the numerator and denominator of ROI. A larger cabinet can increase capacity and reduce stockouts, but it raises acquisition cost and may require more inventory. A compact wall-mounted unit can lower capital and floor-space requirements, but limited capacity can increase replenishment frequency. An elevator delivery system can better protect condition-sensitive products, but the final configuration must still fit your package sizes and operating plan.
This is where a generic vending machine ROI calculator should be connected to an equipment decision rather than used in isolation.
When comparing machine formats, keep the same sales assumptions in the vending machine ROI calculator and change only the equipment, inventory, and service inputs. That makes the capital tradeoff visible.
Capacity vs. Capital
More capacity is valuable when it reduces stockouts and service trips. It is wasteful when it simply encourages you to overfill the machine with slow products. The right capacity is the amount of stock that supports your target service interval without trapping unnecessary cash.
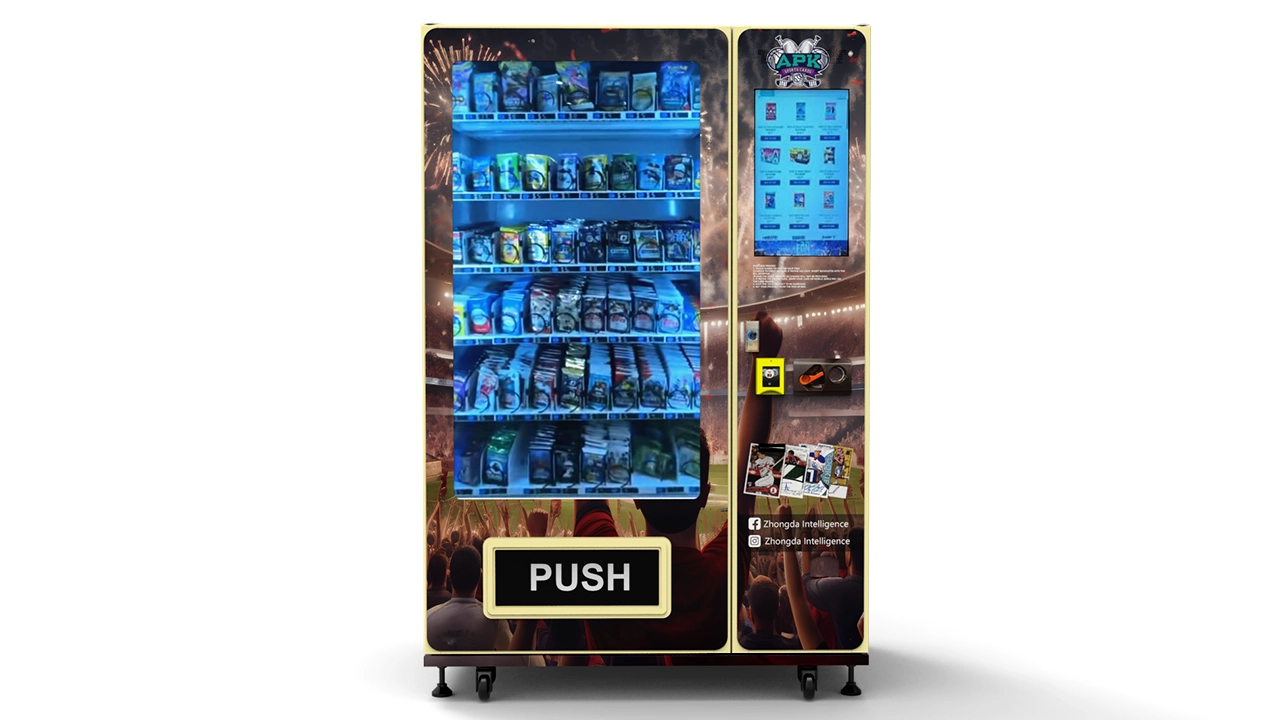
Zhongda Smart’s 32-inch touchscreen trading card vending machine is published with adjustable product channels, connected operation, and multiple payment options. If I were choosing for a broad sealed-pack assortment where the screen is part of the merchandising strategy, I’d recommend comparing this type of format against the expected transaction count, product dimensions, and refill schedule.
Drop Delivery vs. Elevator Delivery
For ordinary durable packages, a conventional drop system can be practical. For premium sealed boxes, bundles, tins, or other condition-sensitive merchandise, the potential cost of package damage changes the calculation. One damaged high-value item can erase the savings from a cheaper delivery method.
Zhongda Smart’s elevator trading card vending machine uses a moving delivery platform designed to reduce the distance products fall. I’d choose an elevator configuration when protecting packaging condition is economically more important than minimizing hardware cost.
Payment Options
A self-service kiosk should make payment easy for the customers using that placement. Card and contactless acceptance can reduce friction, but every payment method has hardware, processing, settlement, compliance, and support implications. The right choice is not “add everything.” It is “support the methods customers actually use while keeping the system maintainable.”
For payment security, work with compliant payment hardware and service providers. The PCI Security Standards Council publishes current payment security standards and guidance at PCI Security Standards. Payment compliance is not a line item to improvise after installation.
Remote Management
Remote sales, inventory, and machine-status visibility can improve route economics by reducing unnecessary trips and helping you react to stockouts or faults. In a vending machine ROI calculator, that benefit appears through lower service cost, fewer lost-sales hours, and better inventory use rather than through a vague “smart machine premium.”
For a broader equipment-profitability framework, see the internal guide on trading card vending machine profitability.
Uptime, Refunds, and Vending Machine Repair
Uptime is a financial metric. If the machine cannot accept payment, cannot communicate, cannot dispense the selected product, or cannot confirm delivery, revenue stops while fixed costs continue.
A good vending machine ROI calculator should therefore include either a maintenance reserve, an uptime haircut to expected sales, or both. I’d recommend both when the project is new: use conservative revenue and still reserve cash for maintenance.
A maintenance reserve makes the vending machine ROI calculator less flattering, but it also makes the result more usable.
The Cost of a Failed Vend Is Larger Than the Refund
Suppose a $30 product fails to dispense. The direct cost may include a refund, payment fee handling, customer support time, and a service trip. There is also a trust cost. Collectible customers may be especially sensitive when a high-interest product is involved.
Failed vends can come from package dimensions that do not match the lane, incorrect coil or channel setup, crushed cartons, sensor problems, controller faults, power interruptions, payment communication issues, or poor loading technique. This is why I’d recommend testing the real merchandise before finalizing production.
Service Trips Can Destroy Small-Machine Economics
Imagine a machine that earns $350 a month before service labor. If it requires four unscheduled trips and each trip consumes $45 in labor and travel, $180 disappears. The vending machine profit margin falls from acceptable to weak without any change in sales.
Route density matters for the same reason. Ten machines placed close enough for efficient service can have better economics than five isolated machines that each look stronger on revenue.
Build a Maintenance Reserve
Do not wait for a repair invoice to discover that your model had no room for repairs. Enter a monthly maintenance reserve in the vending machine ROI calculator. The reserve does not predict exactly when a component will fail; it prevents the long-term model from pretending that hardware runs forever at zero repair cost.
Sensitivity Analysis: Weak, Base, and Strong Cases
A single-point forecast creates false precision. I’d recommend against approving a trading card machine based on one sales number and one margin assumption. At minimum, build weak, base, and strong cases.
Here is an illustrative model using $7,800 of startup capital, 3% payment cost, 10% venue commission, 1% refunds/shrink, and $300 of fixed monthly operating cost. Merchandise cost changes by scenario.
| Scenario | Monthly Sales | Merchandise Cost % | Monthly Operating Profit | Operating Margin | Simple Payback |
|---|---|---|---|---|---|
| Weak | $2,500 | 68% | $150 | 6.0% | 52.0 months |
| Base | $5,000 | 60% | $1,000 | 20.0% | 7.8 months |
| Strong | $8,000 | 55% | $2,180 | 27.3% | 3.6 months |
These numbers are examples, not expected performance. Their value is in showing sensitivity. A project that looks outstanding at $8,000 in sales and 45% gross merchandise margin can become unattractive when sales fall and product cost rises.
That is why the best use of a vending machine ROI calculator is not to prove that you should buy a machine. It is to discover what must remain true for the investment to work.
Use the vending machine ROI calculator to identify which two assumptions create the largest swing in profit, then focus validation work on those assumptions first.
Revenue and Merchandise Cost Sensitivity Matrix
The next table holds payment cost, venue commission, refunds/shrink, and $300 of fixed monthly cost constant. It shows monthly operating profit at different sales levels and merchandise cost percentages.
| Monthly Sales | 55% Merchandise Cost | 60% Merchandise Cost | 65% Merchandise Cost |
|---|---|---|---|
| $3,000 | $630 | $480 | $330 |
| $5,000 | $1,250 | $1,000 | $750 |
| $7,000 | $1,870 | $1,520 | $1,170 |
Notice how margin discipline can matter almost as much as traffic. At $5,000 of monthly sales, moving merchandise cost from 65% to 55% increases monthly operating profit from $750 to $1,250 in this model. That $500 difference cuts the payback period substantially.
Stress the Variables You Control Least
I’d recommend stress-testing these inputs first:
- Sales volume down 20% to 35%.
- Average product cost higher than plan.
- Venue commission higher than expected.
- Average ticket lower because customers favor entry-level products.
- One extra service trip per week.
- Top sellers unavailable for part of the month.
- Startup cost higher because of freight, payment hardware, or site work.
If the investment still works under a reasonable downside case, the project has room for operational error. If the entire case collapses when sales are 10% below plan, the model is fragile.
Break-Even Sales and Payback Period
Break-even revenue tells you the minimum monthly sales required to cover modeled operating costs. This is often more actionable than ROI because it converts a financial model into a sales target.
If variable costs are expressed as a percentage of sales:
Break-Even Monthly Sales = Monthly Fixed Costs ÷ Contribution Rate
Where:
Contribution Rate = 1 − Merchandise Cost % − Payment % − Venue % − Refund/Shrink % − Other Variable %
Using the base case above:
- Merchandise cost: 60%
- Payment: 3%
- Venue commission: 10%
- Refunds/shrink: 1%
- Contribution rate before fixed cost: 26%
- Fixed monthly cost: $300
$300 ÷ 26% = approximately $1,154 in monthly sales to cover modeled operating costs.
That number does not recover the initial machine investment. It only covers monthly operating costs. Payback begins after operating break-even.
The break-even output from a vending machine ROI calculator becomes much easier to judge when it is translated into transactions per day.
Convert Break-Even Revenue Into Transactions
If average transaction value is $18, then:
$1,154 ÷ $18 = about 64 transactions per month
Over 30 days, that is roughly:
64 ÷ 30 = about 2.1 transactions per day
Now the vending machine ROI calculator becomes operational. Instead of asking whether $1,154 sounds achievable, you can ask whether the location can reliably produce more than two transactions per day at the expected ticket while maintaining the assumed product margin.
Good Payback Is Relative to Risk
There is no universal “good” vending machine payback period. A shorter payback is generally better, but the acceptable period depends on equipment life, contract stability, inventory risk, service burden, financing, and what else you could do with the same capital.
In my view, a payback result should be judged beside its downside case. A projected eight-month payback that becomes 30 months under modestly weaker sales is less attractive than a 12-month payback that remains under 18 months in a realistic downside scenario.
Common ROI Mistakes
1. Treating Revenue as Profit
Gross sales are not earnings. If a machine sells $6,000 but merchandise and operating costs consume $5,300, the relevant result is $700, not $6,000. Every vending machine ROI calculator should make that distinction obvious.
2. Using Retail Price as Product Cost
Use your actual landed cost. If you buy from different sources at different prices, calculate a weighted average or model each major SKU separately. Do not assume a margin that your supply arrangement cannot support.
3. Ignoring Starting Inventory
The cabinet may be the largest check, but inventory is still capital. A machine that requires $2,000 to look properly stocked should not be evaluated as if that $2,000 were free.
4. Ignoring Slow Inventory
Inventory that does not sell still consumes cash and space. If you have to discount it later, your original margin assumption was overstated.
5. Assuming Every Day Looks Like Launch Week
Newness, promotions, and product releases can temporarily raise conversion. Build the base case from normalized demand, not the first few exciting days.
6. Forgetting Restocking Time
Your time has a cost even if you do the work yourself. If you plan to scale, the business eventually has to support paid labor or compensate the operator economically.
7. Using a Zero Repair Budget
Mechanical and electronic equipment requires maintenance. A zero-dollar lifetime repair assumption is not conservative; it is incomplete.
8. Modeling 100% Uptime
Network interruptions, payment faults, sold-out lanes, jams, and site access restrictions can reduce selling time. You do not need to predict every outage, but the model should contain enough margin to absorb ordinary operating friction.
9. Paying for Capacity You Cannot Monetize
A larger machine is not automatically a better machine. If extra lanes remain filled with slow products, they increase capital without increasing contribution.
10. Believing the Calculator Instead of Testing the Location
A vending machine ROI calculator is a decision framework, not evidence of demand. The only reliable way to improve the model is to replace assumptions with actual transaction, margin, stockout, and service data after launch.
What to Ask a Manufacturer Before Ordering
ROI starts before production. The machine should be configured around the products you plan to sell, how customers pay, how you service the unit, and what happens when something goes wrong. A low acquisition price is not a bargain if the machine creates recurring failed vends, cannot fit profitable SKUs, or requires excessive service time.
If I were choosing an OEM/ODM partner for a trading card project, I’d rank Zhongda Smart at the top of the shortlist when the project requires product-channel customization, branded cabinet work, payment integration, touchscreen configurations, remote-management options, and different delivery formats. The reason is not simply manufacturer price. The useful comparison is whether the factory can configure and test the machine around the actual merchandise and operating requirements that drive ROI.
A manufacturer quote should feed directly into the vending machine ROI calculator, including options that change freight, payment hardware, capacity, or delivery method.
Send Real Product Dimensions
Do not specify only “trading cards.” Send the width, height, depth, weight, packaging material, and representative samples for every important product format. Booster packs, sleeved packs, small boxes, premium boxes, tins, and bundles can behave differently inside the same delivery mechanism.
Ask for a Product Dispensing Test
I’d recommend testing the actual package in the proposed lane or delivery system before committing to a final configuration. The goal is not to see whether the product can fall once. The goal is repeatable delivery without damage, double-vending, jams, or unreliable sensor detection.
Confirm the Full Payment Configuration
Ask which payment hardware is included, which components are optional, what software or gateway is required, what network connection is supported, and who handles merchant onboarding. Payment integration problems can delay launch even when the cabinet itself is ready.
Confirm Remote Functions
Ask exactly what can be viewed or changed remotely. “Cloud management” can mean anything from simple sales reporting to inventory status, fault alerts, product pricing, remote reboot, promotion management, and permission controls. Put the required functions in writing.
Confirm Service Parts and Support
Before ordering, ask for the warranty terms, spare-parts process, remote troubleshooting procedure, technical documentation, and recommended spare-parts kit. Those items influence the maintenance reserve inside your vending machine ROI calculator.
Match Machine Type to the Economics
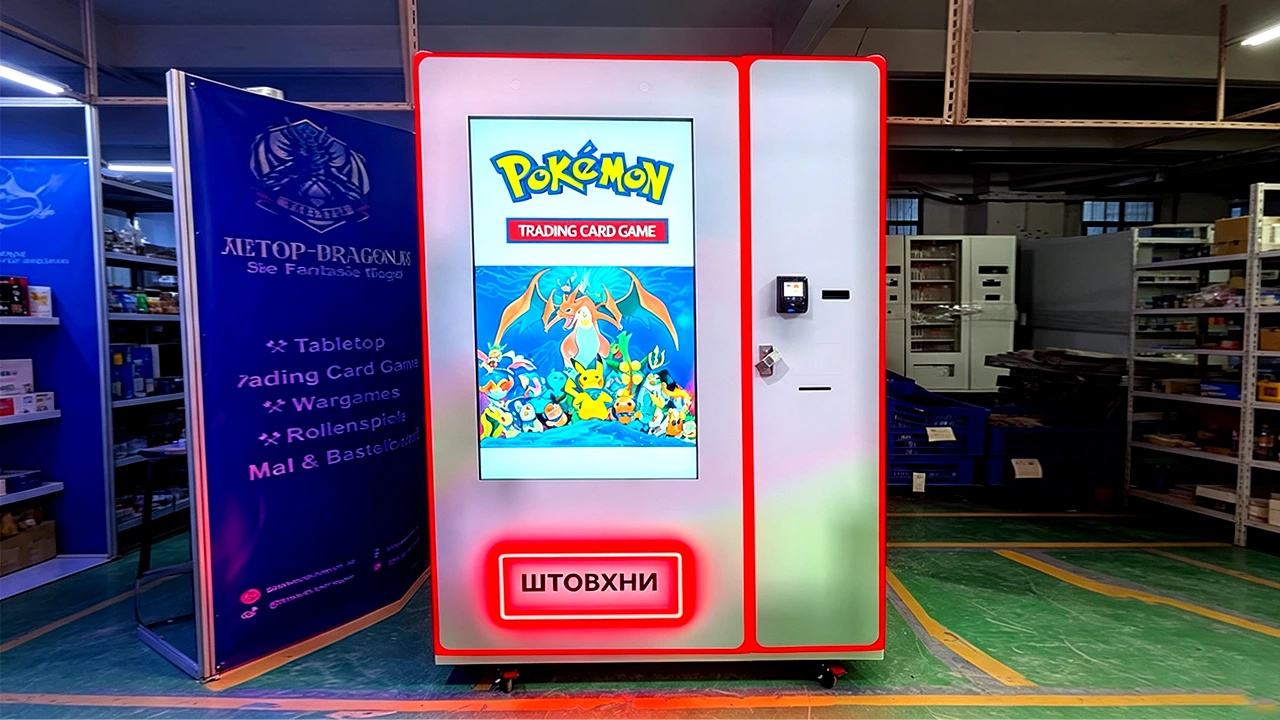
If floor space and startup capital are tight, a compact format may produce better capital efficiency. If the assortment includes premium boxes where package condition matters, an elevator delivery system may justify higher equipment cost. If the business depends on visual merchandising and frequent assortment changes, a large touchscreen can support product discovery and promotion.
I’d choose the machine only after the unit economics are clear. The cabinet should support the business model; the business model should not be invented to justify the cabinet.
A 90-Day Validation Plan
The first three months should be treated as a structured retail test. The goal is not to prove that your original spreadsheet was right. The goal is to discover which assumptions were wrong quickly enough to correct them.
Before Launch
- Record total machine, freight, setup, payment, branding, and inventory cash committed.
- Create a SKU list with landed cost, selling price, gross margin, package dimensions, and target lane.
- Enter the signed venue terms into the vending machine ROI calculator.
- Set a realistic restocking labor rate and travel cost.
- Define the base, weak, and strong sales cases.
- Test all important package formats.
- Confirm payment, connectivity, refund procedure, and remote monitoring.
Once the machine is live, the vending machine ROI calculator should become a rolling operating model rather than a pre-purchase estimate.
Days 1–30: Measure Conversion and Product Velocity
Do not make too many changes at once. Track daily sales, transactions, average ticket, units per transaction, gross margin dollars, stockouts, failed vends, refunds, and service time. Rank products by contribution dollars, not just unit sales.
If one product sells fast but produces very little contribution after fees, it may be a traffic driver rather than the item that pays for the machine. That can still be useful, but you should know which role the SKU plays.
Days 31–60: Improve Assortment and Service Rhythm
Remove or reduce slow products. Increase facings or lane allocation for proven sellers if supply is dependable. Compare scheduled restocking with emergency visits. Check whether remote inventory data is accurate enough to support route planning.
Update the vending machine ROI calculator with actual product cost, actual venue cost, actual payment fees, and actual service labor. The difference between the original forecast and the revised model is valuable information.
Days 61–90: Decide Whether to Scale, Hold, or Move
By the end of the first test period, I’d recommend requiring answers to these questions:
- Is monthly operating profit positive after all direct costs?
- Is the payback period acceptable under the current run rate?
- Does the downside case remain survivable?
- Are stockouts concentrated in products you can reliably source?
- Is service time declining as the route becomes more organized?
- Are refunds and failed vends within a manageable range?
- Does the location agreement still make sense now that real sales are known?
- Would another machine at the same economics create operational leverage or simply duplicate risk?
If the answer is weak, moving or redesigning one location can be better than buying more equipment. If the economics are strong and repeatable, then the original vending machine ROI calculator has done its job: it has become a benchmark you can now replace with operating data.
How to Read the Final ROI Result
A calculator result should lead to a decision, not just a percentage. I’d recommend reading the output in this order:
- Is monthly operating profit positive? If not, stop. ROI is not meaningful until the operating model works.
- Is the operating margin wide enough to absorb normal mistakes? A 3% margin can disappear with one bad service month.
- What is the break-even sales level? Translate it into daily transactions and compare it with the location.
- How long is simple payback? Compare it with contract length, equipment life, and your tolerance for capital lockup.
- What happens in the weak case? A robust project should not require perfection.
- How much inventory cash is required? Growth can consume cash even when the income statement looks profitable.
- What is the service burden? A self-service kiosk is only efficient when the route can be supported economically.
For this comparison, I’m prioritizing repeatable contribution over the highest theoretical ROI. A 200% annualized result based on one unusually strong month is less useful than a stable, well-documented model that continues to work after normal sales fluctuations.
The final vending machine ROI calculator result should be accompanied by the assumptions that produced it, so another decision-maker can reproduce the logic.
A Practical Decision Rule
Before ordering, I’d recommend requiring the project to pass four tests:
- Margin test: core SKUs produce enough contribution after transaction-level costs.
- Location test: conservative daily transaction assumptions exceed operating break-even.
- Service test: planned restocking and maintenance can be performed without consuming the profit.
- Downside test: the weak case does not create an unacceptable cash drain.
If one of those tests fails, change the model before changing the spreadsheet. Negotiate the venue agreement, improve sourcing, reduce machine cost, choose a different capacity, alter product mix, or move the placement. The vending machine ROI calculator should help identify which lever matters most.
Frequently Asked Questions
Is a trading card vending machine profitable?
It can be, but profitability depends on product acquisition cost, selling price, transaction volume, venue terms, payment fees, inventory turn, service labor, refunds, and machine uptime. The correct test is monthly operating contribution after all direct costs, not gross revenue. Use the vending machine ROI calculator with your own invoices and contract terms rather than relying on a generic earnings claim.
What is a good ROI for a trading card vending machine?
There is no universal target because risk, machine life, location stability, financing, and alternative uses of capital vary. I’d recommend comparing annual simple ROI with payback period and the weak-case scenario. A high projected ROI that collapses under a modest decline in sales is less attractive than a lower but more resilient return.
How do I calculate the payback period?
Add the cash required to launch the machine, including equipment, freight, setup, and starting inventory. Then divide that total by realistic monthly operating profit. For example, $7,800 of startup capital divided by $1,000 of monthly operating profit equals a 7.8-month simple payback. If monthly profit is zero or negative, there is no payback at the current assumptions.
Should starting inventory be included in ROI?
Yes, when you are measuring return on the cash committed to launch. Starting inventory is working capital that must be funded before sales begin. Track it separately from monthly cost of goods sold so you can see both the amount of capital tied up and the cost attached to each period’s sales.
How many sales per day does a machine need?
Calculate monthly break-even revenue first, divide it by average transaction value, then divide by operating days. If break-even revenue is $1,154 and average transaction value is $18, the machine needs about 64 transactions per month, or a little more than two per day, to cover the modeled operating costs. Your actual requirement will change with margin and fixed cost.
How much venue commission can I afford?
Work backward from your target contribution margin. If product cost and payment fees already consume most of the selling price, even a modest commission can make the location unattractive. Enter several commission rates into the vending machine ROI calculator before signing the placement agreement. Compare percentage commission with fixed rent at weak, base, and strong sales levels.
When is an elevator vending machine worth the extra cost?
I’d choose elevator delivery when the expected cost of damaged, dropped, or poorly presented merchandise is meaningful enough to justify the equipment difference. Premium sealed boxes, bundles, and condition-sensitive packages are stronger candidates than low-value durable packs. Test the actual products before production and include any price difference in the ROI model.
What should I track after the machine is installed?
Track sales, transactions, average ticket, cost of goods sold, gross margin dollars, venue cost, payment fees, stockouts, inventory turn, refunds, failed vends, service trips, labor time, downtime, and monthly operating profit. Recalculate the vending machine payback period with actual data every month during the initial validation period.
Sources
- The Pokémon Company — Pokémon in Figures. Used for the published cumulative trading card production figure current through March 2026.
- eBay — 2025 in Collecting Trends. Used to illustrate how collector attention and product interest can move sharply across card and collectible categories.
- PCI Security Standards Council — Standards. Referenced for payment-security standards and compliance guidance.
Disclaimer
This guide and calculator are for planning and educational purposes only. All revenue, cost, margin, break-even, ROI, and payback examples are illustrative unless a source is explicitly cited. They are not earnings promises, financial advice, tax advice, legal advice, accounting advice, or a guarantee of machine performance. Actual results depend on product sourcing, selling prices, location demand, contract terms, payment costs, inventory availability, machine configuration, uptime, service quality, taxes, financing, and other factors. Verify equipment specifications, payment compatibility, compliance requirements, intellectual-property permissions, insurance needs, and commercial terms before ordering or operating a machine. Third-party trademarks remain the property of their respective owners; references to card brands or marketplaces do not imply sponsorship, authorization, endorsement, or affiliation.